See on Scoop.it - Education Futures
See on netmagazine.com
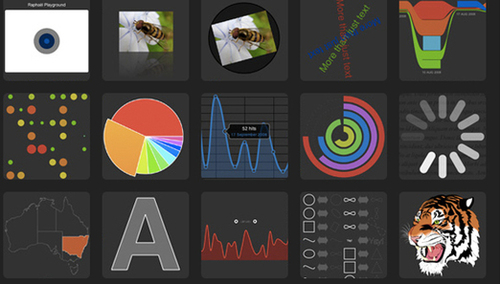
via Tumblr The top 20 data visualisation tools
From simple charts to complex maps and infographics, Brian Suda’s round-up of the best – and mostly free – tools has everything you need to bring your data to life…
A common question is how to get started with data visualisations. Beyond following blogs, you need to practice – and to practice, you need to understand the tools available. In this article, get introduced to 20 different tools for creating visualisations: from simple charts to complex graphs, maps and infographics. Almost everything here is available for free, and \you may have installed already…
See on netmagazine.com
via Tumblr The top 20 data visualisation tools
No comments:
Post a Comment
Note: Only a member of this blog may post a comment.